Monitoring Views
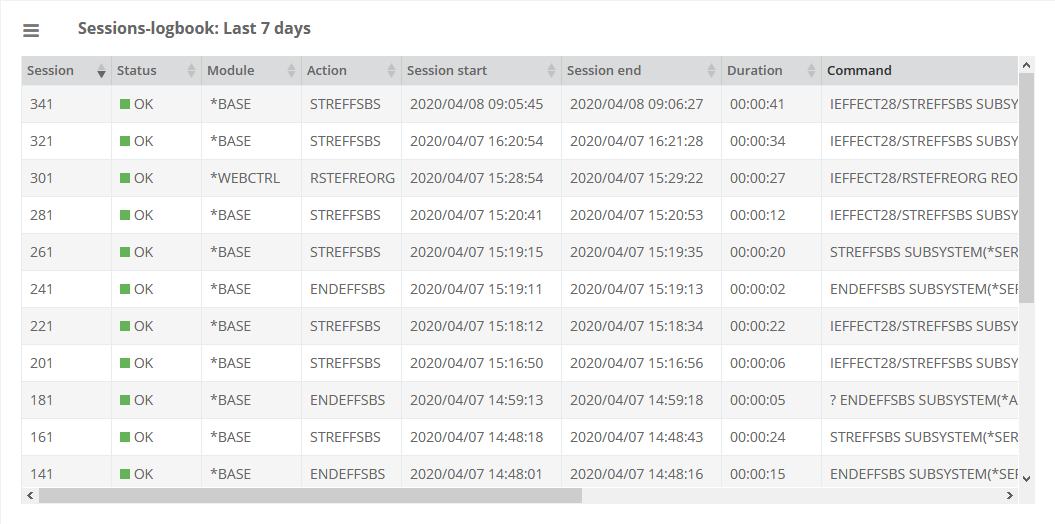
Since i-effect 2.7, tables from the Monitoring section can be displayed on the dashboard. For this purpose, a filter view of a logbook page is selected and displayed on the dashboard with up to 100 filter entries. . The predefined system filters as well as the filters saved by each user for himself are available for selection.
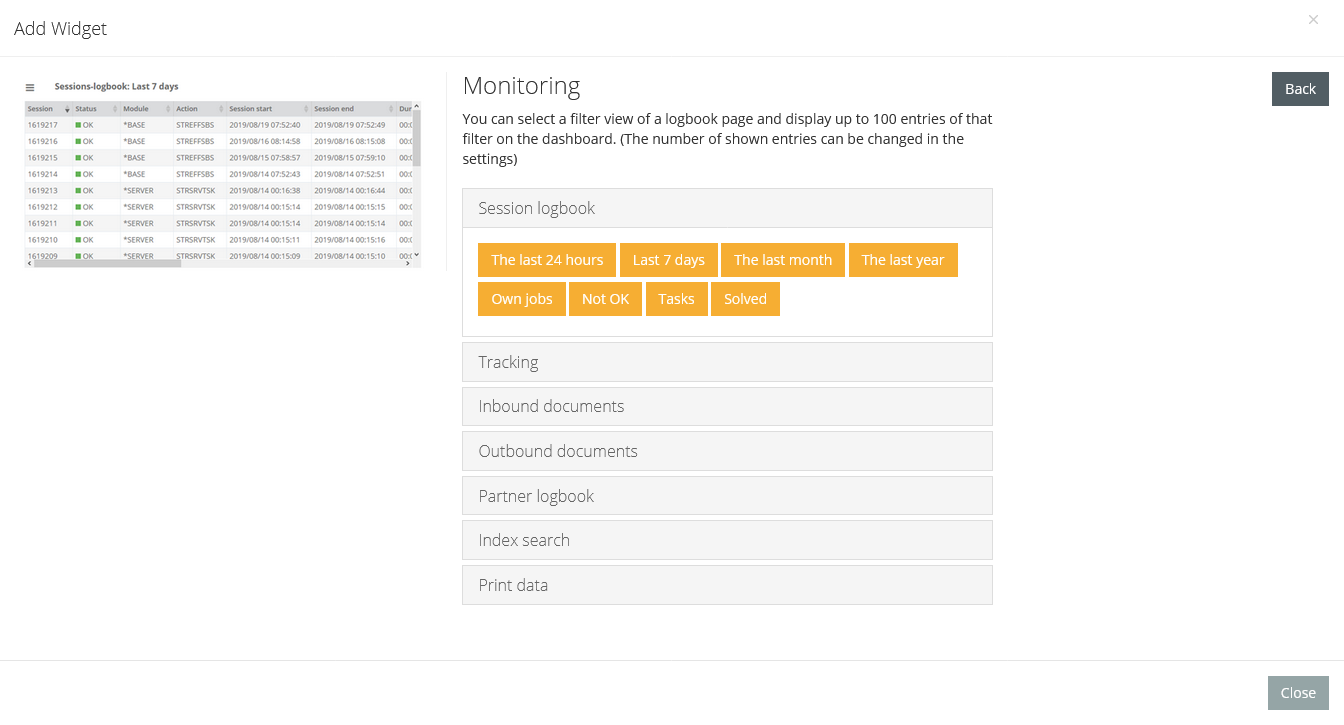
In the widget itself, columns can be shown or hidden and the order and sorting can be adjusted. The number of entries shown can be changed in the settings.