Diagram logbook
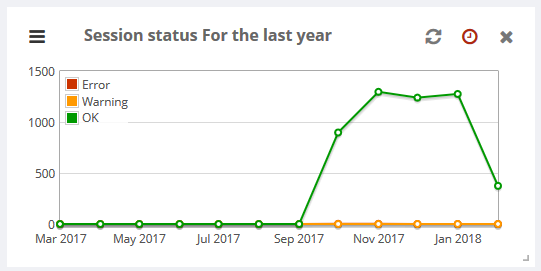
The diagrams are a graphical evaluation of the system activities over a certain period of time. You can choose between four displays that show either the session status, all sessions or the sent or received objects.
The session status compares the error-free, terminated and faulty sessions in one overview, while the other charts show only one value at a time.
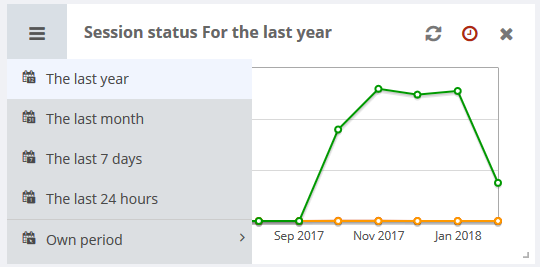
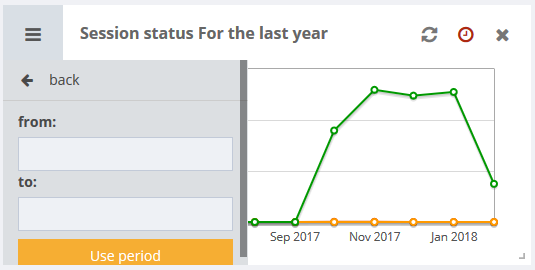
The display can be customized via the menu. Both a fixed period and a free date can be selected. To set a free date, open the dropdown and select own period.
As a special feature, a live view can be activated for the diagrams for the entire session and for the sent and received objects. The display then changes to a so-called live chart, which updates itself in a defined interval and displays the activities of the last 60 seconds. The live view can be stopped by a pause button.
The settings can be used to set the interval at which the live views are updated. The recommended default value is 2 seconds.