Create a report
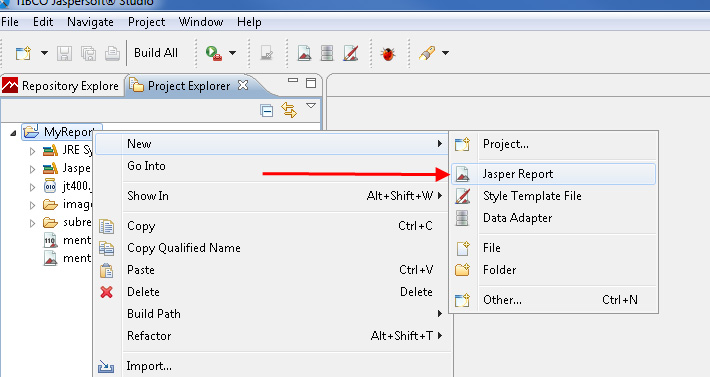
Change to the „Project Explorer" and choose „new=> Jasper Report" via right clicking the „MyReports" project.
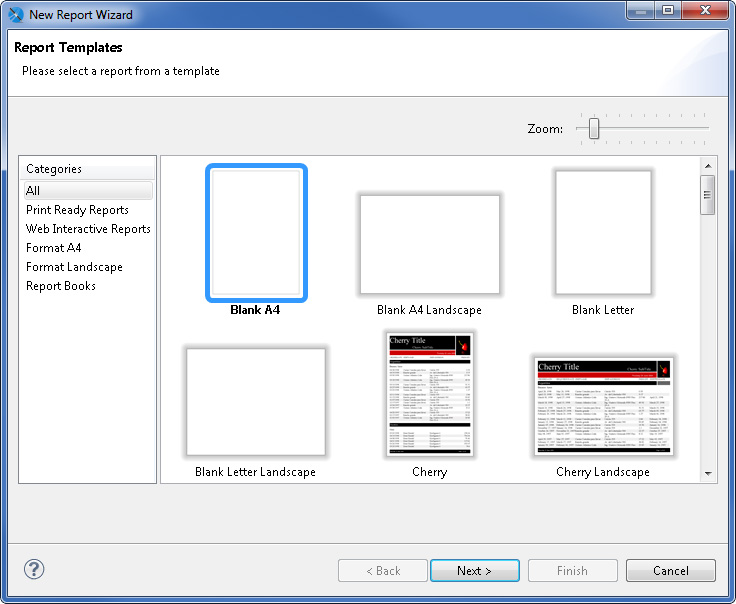
In the following selection screen you can select many premade reports or with the help of the Report Wizard in a leaded dialogue give additional entries to a report in the making.
In this instruction we show you the creation of a new, empty report with a connection to the DB2 database.
Further information to iReport, its elements and detailed information for using all the application's functions please take from the producer's publication as well as the Online Help that can be activated via pressing the F1-Helpbutton at any time.
For our example please select the template "Blank A4" and click "next".
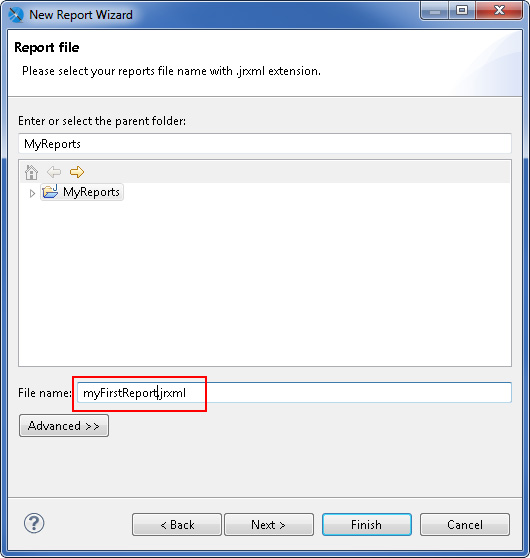
Name the new report "MyFirstReport" and click on "next".
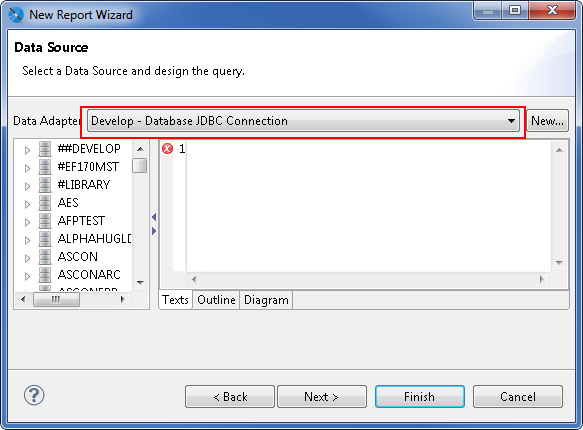
Now choose your previously created DB "Data Adapter" and click "finish".
You are now located directly in the graphical editing mode and can create a new connection to your database and design the report.
Right click "MyFirstReport" in "Outliner" on the bottom left and choose "Dataset and Query".
In the following dialogue you can define the SQL query for your DB2 files that are to be placed in the report that we are creating. With this data query, Jaspersoft Studio gains access to the records and sections of the chosen databases and tables.
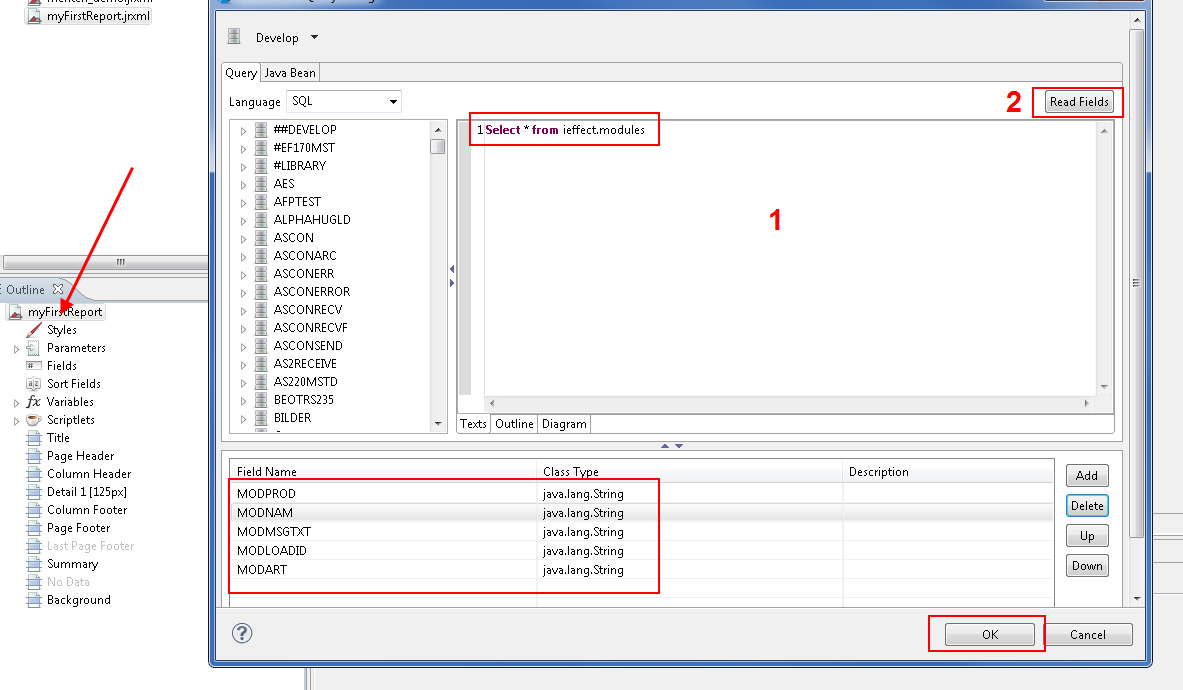
Enter the SQL statement in the window for (1) and click on "Read Fields"(2).
In this example we use an easy data query on the module table of i-effect:
„select * from ieffect.modules"In the lower window the section names are displayed as the outcome of the query. Accept the dialogue with "OK" and return to the design screen.
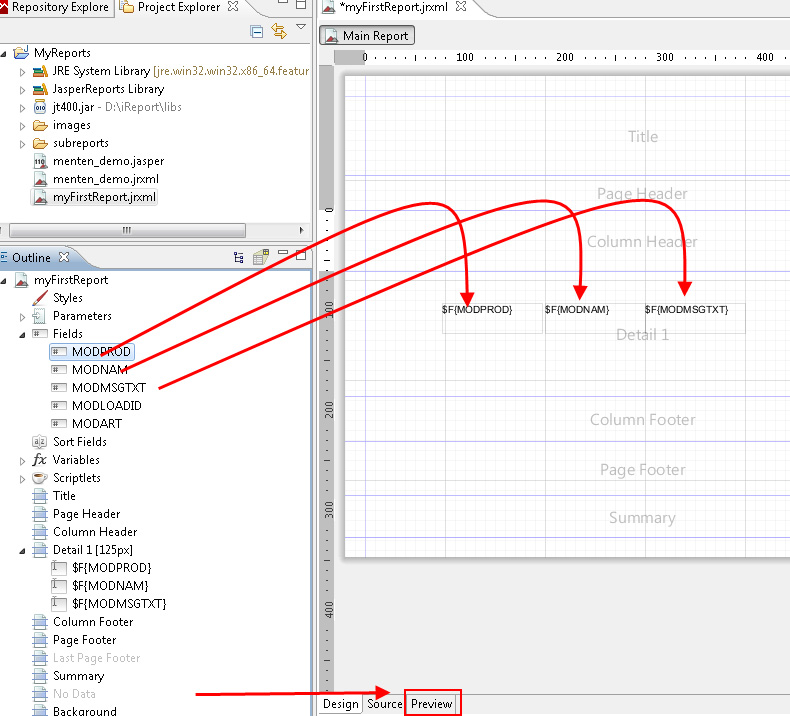
As soon as you pop up the option "Fields" in the left overview, you see the sections of your resulted table from the data query.
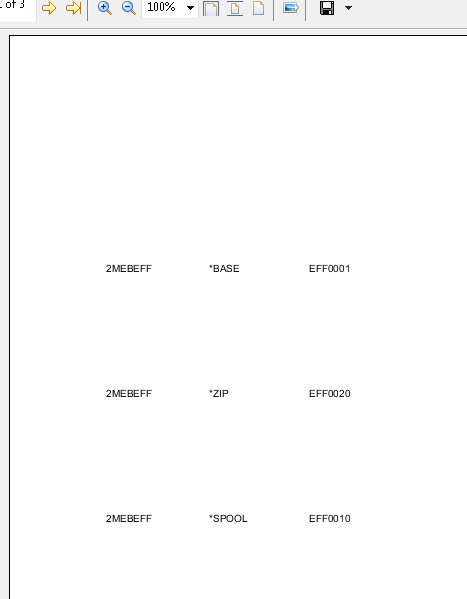
Via drag and drop of the sections, position the elements in the detail area of the report. Here, three sections from the query were positioned side by side in the report to result in a table-like list of the files. Decrease now the height of the detail area on the necessary minimum via clicking twice on the bottom line. Add a static text for the headline. Now you can click "Preview" to look at the final report.
A report that is created like this is saved with the ending ".jrxml". For our example, the file is called "MyFirstReport.jrxml". To execute the report inside i-effect, it is necessary to place this file on the IBM Power System.
In i-effect you will be using the following code to create the report (In this example we think, that the report is placed in the folder /tmp ):
IEFFECT/RUNREPORT REPORTXML(‚/tmp/MyFirstReport.jrxml')
 DBUSER( )
 OUTPFILE(‚/tmp/ModuleList.pdf')
Replace and for the required username and the password so i-effect gains access to your database. If no user and password is given, name and password of the currently logged in user are used for the DB log-in. This code creates the report in the form of a PDF-file and saves the result in the file „/tmp/ModuleList.pdf".
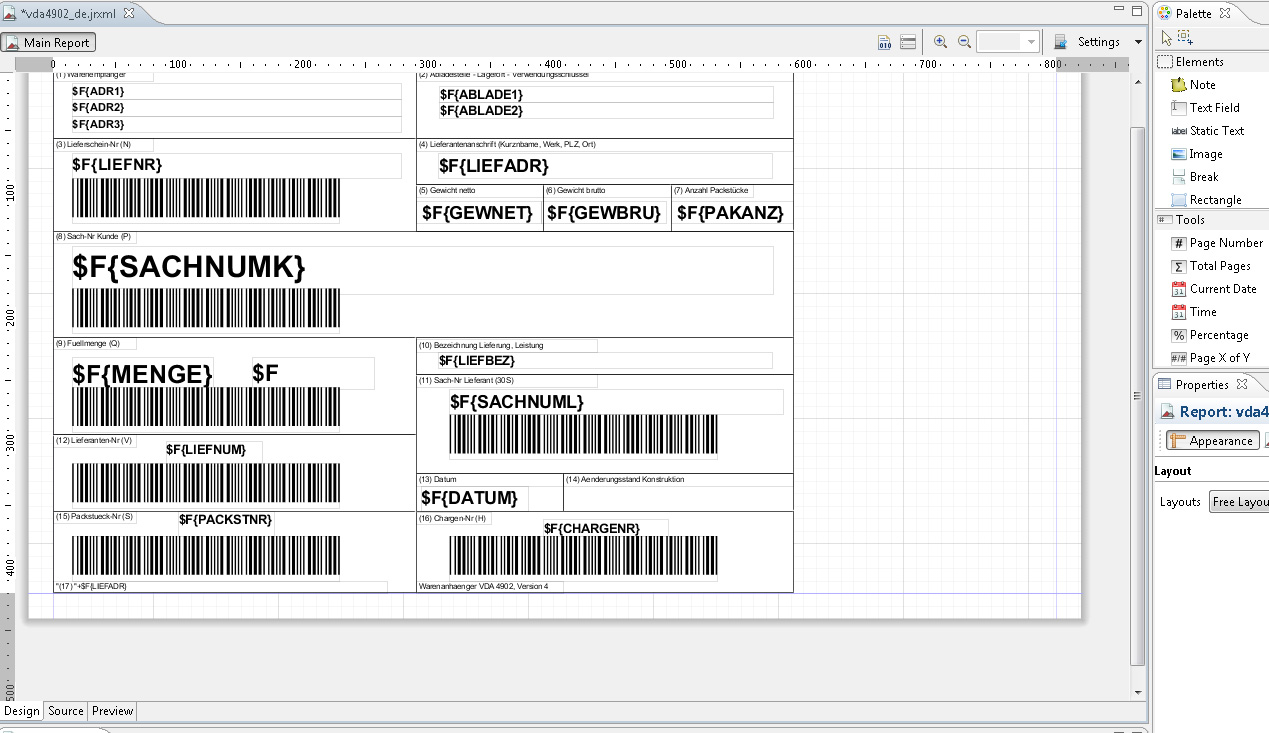
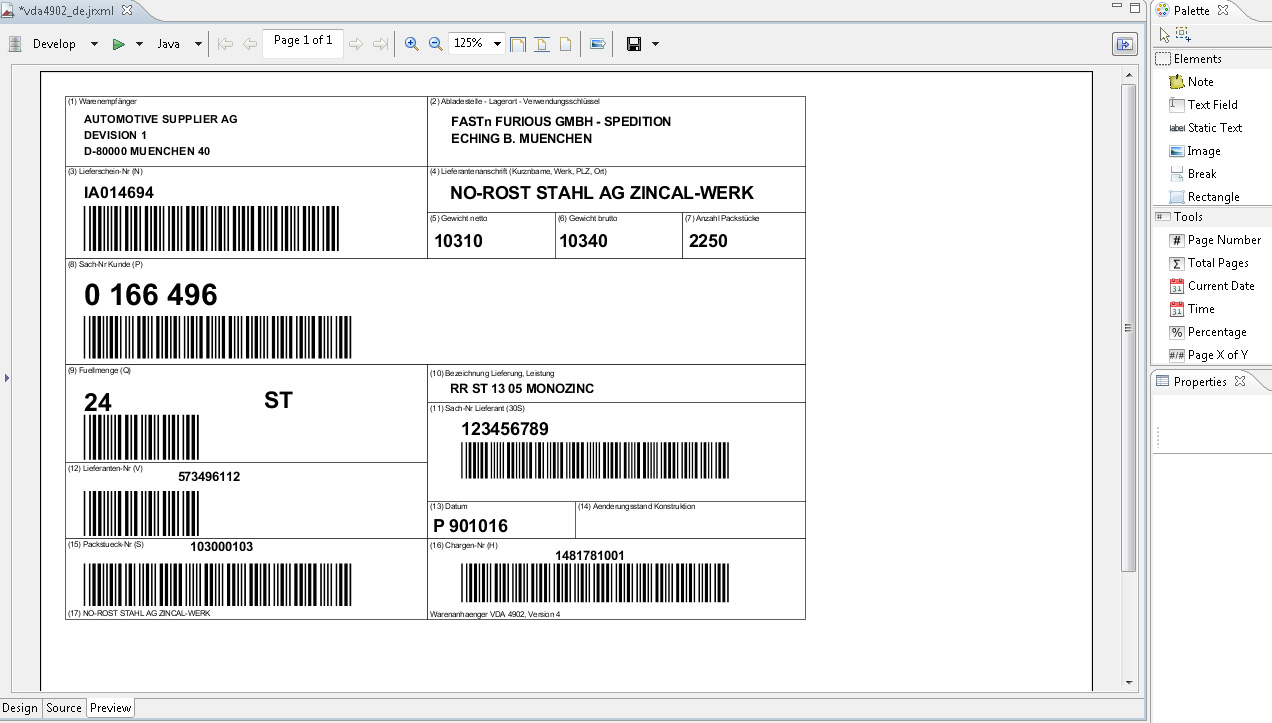
More complex reports, like like the in the delivery included example of a VDA4902 product trailer are created with the same principle.